/filters:background_color(white)/2024-01/BL54L15-Group.png)
Shorter Connection Intervals for Lower Latency
Recent additions to the Bluetooth specification have improved low-latency performance significantly, making it a viable option for applications where minimal messaging latency is critical. This article examines the new Bluetooth 6.2 Shorter Connection Interval (SCI) feature, highlighting test results to help you decide whether it is worth a look for your low-latency wireless connectivity application.
Two tests were performed using a pair of Ezurio BL54L15 DVK boards separated by ~2 m. The first test captures results from running theshorter_connection_intervals sample provided with the nRF Connect SDK. A second test captures rising-edge timing of a GPIO pin toggling on each board, driven by BLE GATT messaging.With SCI, Bluetooth 6.2 introduces sub-millisecond connection intervals with a minimum of 750 µs on the nRF54L15 radio (and a specification minimum of 125 µs), compared to the 7.5 ms minimum in Bluetooth 5.x. SCI promises lower end-to-end average transmission latency, improving performance for latency-sensitive wireless applications such as audio, industrial control and HMI peripherals.
The nRF Connect SCI Sample – Latency Service
Test Configuration
| Parameter | Value |
|---|---|
| Hardware | 2 × Ezurio BL54L15 DVK |
| SDK | nRF Connect SDK v3.2.3 (Zephyr v4.2.99) |
| Controller | Nordic SoftDevice Controller v155.28779 |
| HCI version | 6.2 |
| Application Sample | shorter_connection_intervals |
| PHY | LE 2M |
| Frame spacing | 63 µs |
| Role | Central initiates all interval updates |
| Intervals tested | 750 µs - 1,000 µs - 1,250 µs - 2,000 µs - 4,000 µs |
| Rounds | 3 (continuous, automatic cycling) |
| Samples per interval | ~14 per device per round (~42 combined across 3 rounds) |
For this test, the central device initiated all connection interval changes via the SCI characteristic. Both devices independently reported round-trip transmission latency via the Latency service. The first measurement after each interval change was excluded as a transition artifact.
Results
| Connection Interval | Central Mean | Central Range | Peripheral Mean | Peripheral Range |
|---|---|---|---|---|
| 750 µs | 859 µs | 746 – 1,215 µs | 841 µs | 630 – 1,284 µs |
| 1,000 µs | 1,055 µs | 822 – 1,918 µs | 969 µs | 749 – 1,215 µs |
| 1,250 µs | 1,275 µs | 985 – 1,711 µs | 1,178 µs | 880 – 1,411 µs |
| 2,000 µs | 1,880 µs | 1,346 – 3,911 µs | 1,810 µs | 1,256 – 2,530 µs |
| 4,000 µs | 3,390 µs | 2,374 – 4,330 µs | 3,543 µs | 2,286 – 5,991 µs |
Table 1 – Latency Measurements Table, nRFConnect SCI Sample
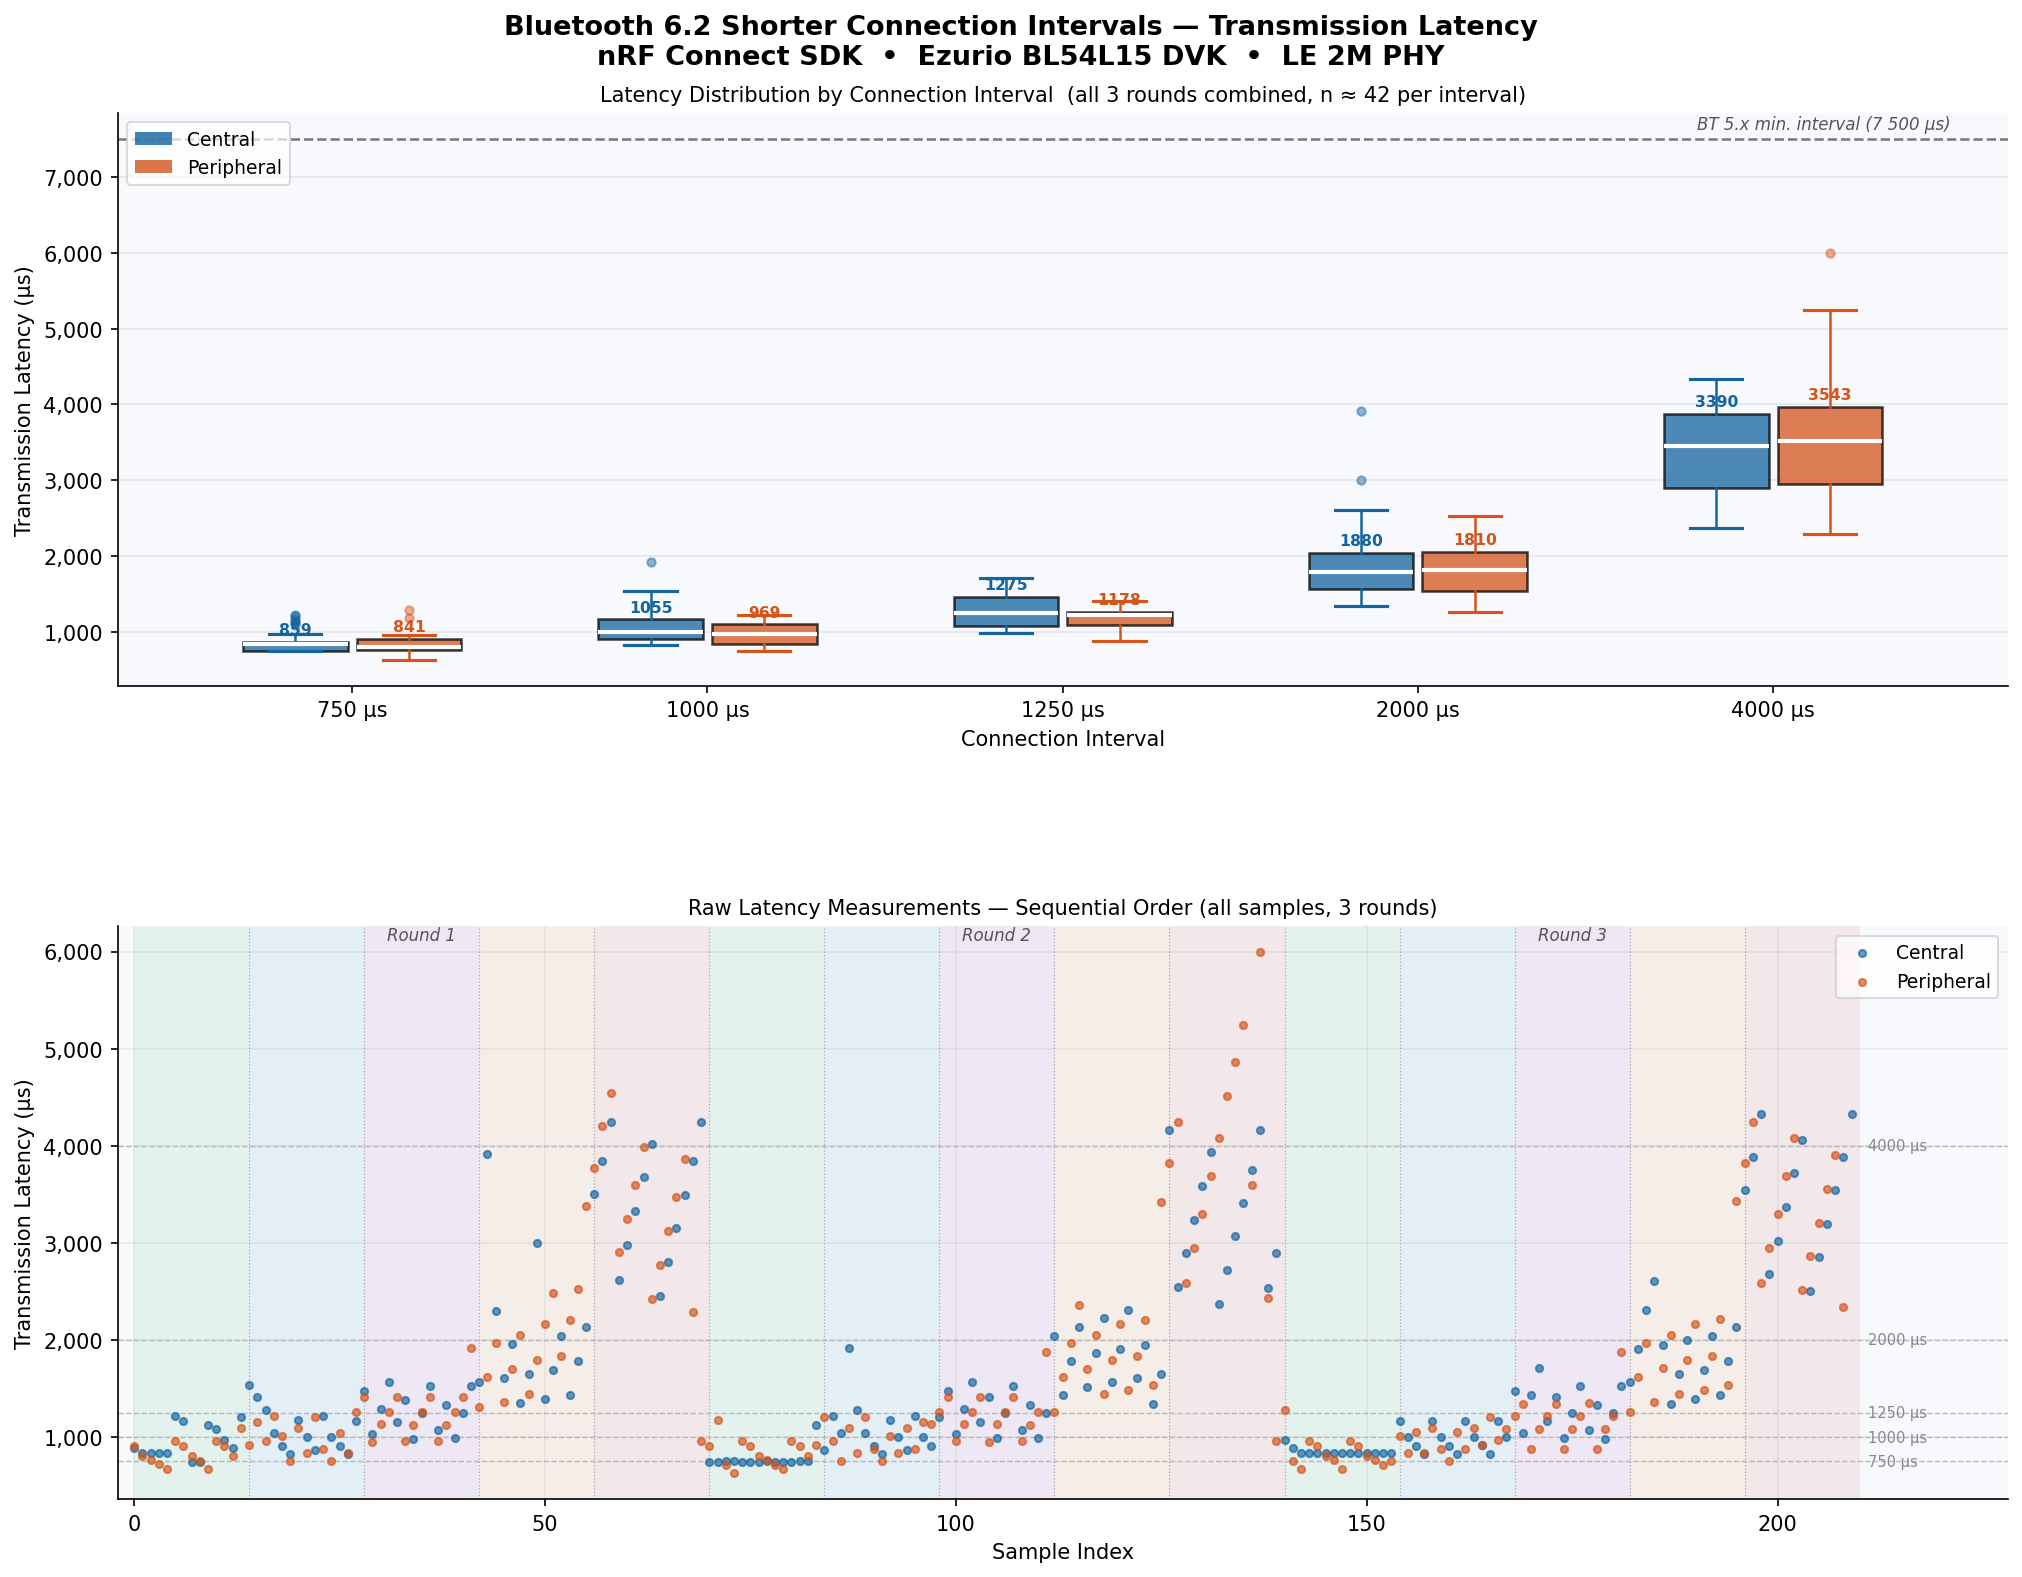
Figure 1 – Latency Summary (all 3 rounds combined), nRFConnect SCI Sample
The chart contains two panels:
- Box plot (top): Distribution of transmission latency at each connection interval for both Central and Peripheral across all 3 rounds. The Bluetooth 5.x minimum interval (7,500 µs) is shown as a dashed reference line, illustrating the headroom gained by Bluetooth 6.2 SCI.
- Time series (bottom): All raw latency measurements in sequential order across the 3 rounds, color-banded by active connection interval. Vertical dotted lines mark interval transition points.
Key Findings
- Latency tracks tightly with connection interval. At 750 µs, mean latency was below 860 µs on both devices (within ~15% of the interval value) indicating efficient, near-optimal scheduling.
- Results are consistent across 3 rounds. All three rounds produced closely matching latency distributions, demonstrating repeatable and stable Bluetooth 6.2 SCI behavior.
- Variability increases at wider intervals. The 4,000 µs interval showed the widest IQR and highest outliers. The peripheral recorded one measurement of ~5,991 µs (~1.5× the interval), highlighting the latency impact of a missed connection event at that interval.
- Comparison to Bluetooth 5.x: For this test at 750 µs, the mean latency was approximately 9× lower than the Bluetooth 5.x minimum connection interval of 7.5 ms. The Bluetooth 6.2 specification supports intervals down to 125 µs, which could extend this advantage even further.
Measuring One-Way GATT Message Latency
To more closely reflect a real-world use-case, a small embedded application was developed to make a direct hardware measurement of one-way BLE transmission latency across a range of connection intervals. The central board pulsed a TX GPIO pin high immediately before issuing a GATT Write Without Response message, synchronized to the BLE connection event using MPSL radio notification callbacks. The peripheral board pulsed an RX GPIO pin high on receipt of each GATT message. A logic analyzer was used to capture the rising-edge delta between the two pins (the latency measurement) and the logic analyzer’s statistics function was used to record mean, minimum, maximum and standard deviation over the captured samples.
Measurements were taken at 12 different connection intervals in sequence, holding each long enough to collect 100 samples before advancing to the next step. Intervals below 7.5 ms used thebt_conn_le_conn_rate_request API, with 2M PHY and 63 µs frame spacing negotiated at connection setup. Intervals at and above 7.5 ms used the bt_conn_le_param_update API, which is the standard Bluetooth 5.x parameter update mechanism.Test Configuration
| Parameter | Value |
|---|---|
| Hardware | 2 × Ezurio BL54L15 DVK |
| SDK | nRF Connect SDK v3.2.3 (Zephyr v4.2.99) |
| Controller | Nordic SoftDevice Controller |
| PHY | LE 2M |
| Frame spacing | 63 µs (negotiated via bt_conn_le_frame_space_update) |
| Samples per step | 100 |
| Measurement | Logic analyzer TX GPIO rising edge → RX GPIO rising edge (statistics over all samples) |
Results
| Trial | Samples | Connection Interval (µs) | Mean (ms) | Min (ms) | Max (ms) | Std Dev (ms) |
|---|---|---|---|---|---|---|
| 1 | 100 | 750 | 0.76811 | 0.69432 | 2.9898 | 0.26745 |
| 2 | 100 | 1000 | 0.97889 | 0.84144 | 3.8337 | 0.51201 |
| 3 | 100 | 1500 | 0.90114 | 0.83148 | 2.513 | 0.29695 |
| 4 | 100 | 2000 | 0.97886 | 0.81856 | 3.001 | 0.53661 |
| 5 | 100 | 4000 | 0.98971 | 0.8203 | 5.0504 | 0.73779 |
| 6 | 100 | 7500 | 1.3296 | 0.8246 | 8.5407 | 1.8514 |
| 7 | 100 | 8750 | 1.0202 | 0.8265 | 9.5766 | 1.2038 |
| 8 | 100 | 10000 | 1.0309 | 0.8284 | 10.828 | 1.3686 |
| 9 | 100 | 15000 | 1.5777 | 0.83655 | 16.02 | 3.2453 |
| 10 | 100 | 30000 | 2.3291 | 0.8284 | 31.05 | 6.5239 |
| 11 | 100 | 40000 | 4.1114 | 0.8444 | 41.028 | 10.947 |
| 12 | 100 | 50000 | 3.149 | 0.8284 | 51.049 | 10.507 |
Table 2 – GPIO-based Latency Measurements Table, GATT messaging test
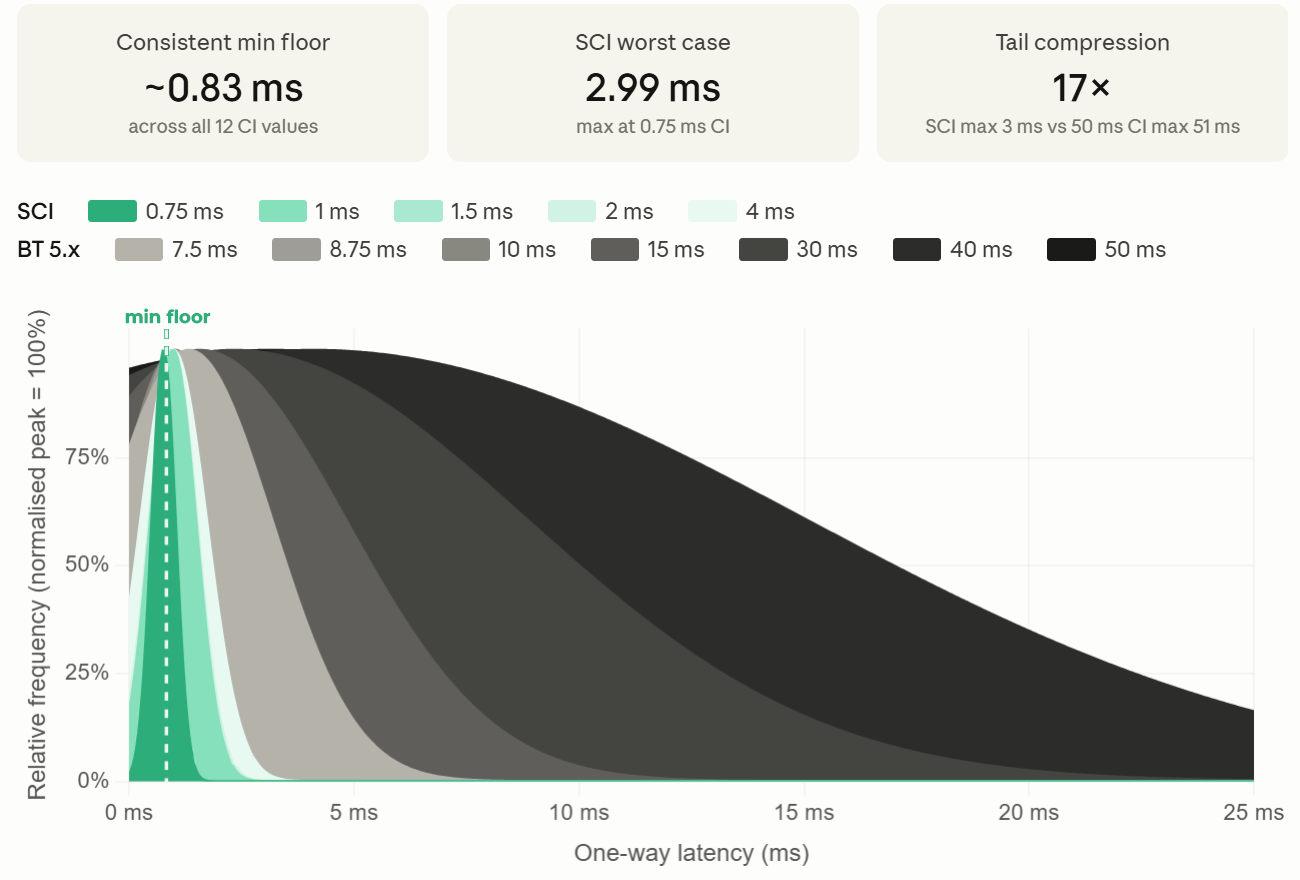
Figure 2 – Normal distribution approximation highlighting measurements taken at connection intervals with SCI (green) vs. BT 5.x (gray), GATT messaging test
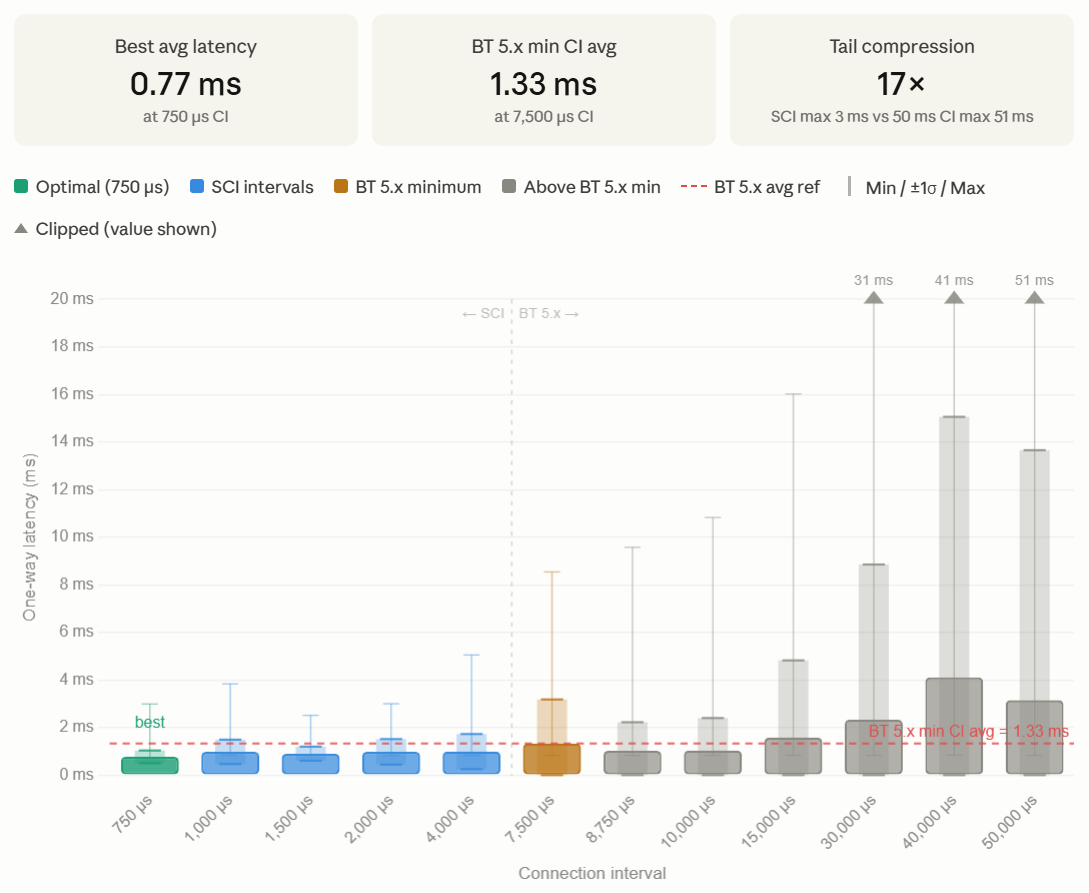
Figure 3 – Central to peripheral latency at various connection intervals, GATT messaging test
Key Findings
- The minimum floor is ~0.83 ms universally. Across every connection interval tested from (750 µs to 50 ms) the measured minimum latency is remarkably consistent at 0.83–0.87 ms. This represents the best-case delivery time (notification fires, write queues successfully, and goes out in the same connection event), and it is essentially independent of the connection interval. It is roughly the sum of the MPSL notification lead time (550 µs) and the radio path time (~280 µs).
- Average latency is nearly flat across the entire SCI range. All five SCI steps (750–4,000 µs) produce average latencies between 0.77 ms and 0.99 ms; a difference of just 0.22 ms across a 5× range of connection intervals. This confirms that for the typical delivery case, CI has almost no effect on mean latency if messages are synchronized with the connection interval.
- Standard deviation scales proportionally with CI, not average latency. This is the clearest signature of the occasional missed-event model: most deliveries land near 1 ms regardless of CI, but when a write misses its connection event the penalty equals at least one CI. At 750 µs the σ is 0.27 ms; at 50,000 µs it is 10.5 ms; a 39× increase for a 67× increase in CI. For applications where timing consistency matters, this is the dominant metric.
- Maximum latency tracks directly to CI for BT 5.x intervals and above. For every step from 7.5 ms upward, the measured maximum is very close to CI + ~1 ms (one missed event plus the normal delivery time). At 50 ms CI the max is 51.05 ms, at 7.5 ms it is 8.54 ms. This confirms the bimodal delivery model; worst-case latency is directly determined by the CI choice.
- 750 µs CI is the optimal operating point. For this hardware setup, 750 µs achieves the lowest average (0.77 ms), the lowest standard deviation (0.27 ms), and the lowest maximum (2.99 ms) of any step tested. The slightly higher maximum at 1,000 µs (3.83 ms) and 2,000 µs (3.00 ms) compared to 1,500 µs (2.51 ms) suggests some sensitivity to connection event scheduling at very short intervals; 1,500 µs stands out as a stable alternative if 750 µs proves too aggressive for a given application.
- The tail compression from SCI to extended BT 5.x is 17×. The worst-case latency at 750 µs CI (2.99 ms) versus 50,000 µs CI (51.05 ms) represents a 17× reduction in maximum observed delay. For latency-sensitive applications this matters more than the 1.73× improvement in mean latency, because it is the tail — not the average — that drives dropped frames, input lag, or control loop instability.
Summary
Two independent test methods applied to the Ezurio BL54L15 module/DVK confirm that Bluetooth 6.2 Shorter Connection Intervals deliver a substantial and repeatable reduction in wireless transmission latency compared to Bluetooth 5.x connection intervals.
The nRFConnect SDKshorter_connection_intervals sample established that the hardware minimum of 750 µs is fully achievable on the BL54L15 module, with mean round-trip latency below 860 µs (within 15% of the interval itself) across three consistent measurement rounds. The custom GPIO sweep firmware extended this characterization across twelve connection intervals from 750 µs to 50 ms, using direct logic-analyzer measurement of one-way latency to eliminate any software-layer ambiguity. The practical optimum setting is 750 µs, while 1,500 µs provides good performance if 750 µs is too aggressive. Against the Bluetooth 5.x minimum of 7,500 µs, the 750 µs CI delivers a 17x reduction in worst-case observed delay, directly improving application-level timing predictability.Taken together, these results validate BT 6.2 SCI as a viable path to sub-millisecond wireless latency with the Ezurio BL54L15 Bluetooth Low Energy module. For applications requiring deterministic low-latency BLE (e.g., audio, industrial control, HMI peripherals) a connection interval of 750–1,500 µs represents the best balance of latency, jitter, and scheduling efficiency.